The Implementation of STDEV for values from 3 columns in the table

Standard deviation is the degree of dispersion or the scatter of the data points relative to its mean, in descriptive statistics. It’s often used in data analysis and reports. And, of course, how to calculate Standard deviation in PowerBI is very important to know.
There’s a function STDEV in Excel, which takes several arguments, but there's no equivalent in Powebi. However, you can achieve similar functionality using DAX (Data Analysis Expressions), the formula language in Power BI.
Of course, there are functions STDEV.P and STDEV.S
- StandardDeviationPopulation = STDEV.P(<column>)
- StandardDeviationSample = STDEV.S(<column>)
But if you want to calculate STDEV and use other rows of the table, you can’t do that with the built-in formula. Obviously, we need to implement STDEV by ourselves.
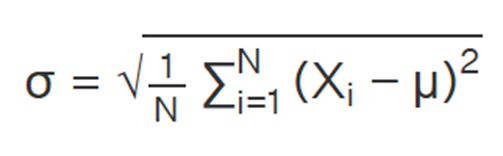
σ = Population standard deviation symbol
μ = Population mean
N = total number of observations
For the case of 3 values the formula looks like this:
STDEVGrow =
VAR N = 3
VAR avgGrow = (dataTableName[RateN] + dataTableName[RateN_1] + dataTableName[RateN_2]) / 3
VAR Result = SQRT( ( (dataTableName[RateN] - avgGrow)^2 + (dataTableName[RateN_1] - avgGrow)^2 + (dataTableName[RateN_2] - avgGrow)^2)  / N)

return Result
I added this var as a Create New Column for the table ‘dataTableName’
 Get the Quarter of the Year in PowerBI