Improve Site Quality with Lighthouse

Sometimes I like to use calculate different measures for one or another site. Last weekend I read about Lighthouse – it’s a part of DevTools in Google Chrome. I have already forgotten that I have such a powerful tool in my pocket and don’t use it. What is Lighthouse? Lighthouse is an open-source, automated tool for improving the performance, quality, and correctness of your web apps.
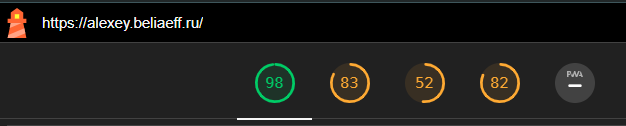
When I first executed my personal site, the indicators were not very poor, but far from good.
A lot of low indicators were connected with the usage of HTTP1.1 instead of HTTP2.
At my VPS I have Debian 11, and it took me a bit time to upgrade OPENSSL from 1.1.11 to 3.3.0. It was required to use HTTP2 instead of HTTP1.1. Of course, some manipulations with NGINX config file also were done. Thanks to the author of the post How To Install OpenSSL 3 on Debian 11 - Quick Guide - OrcaCore
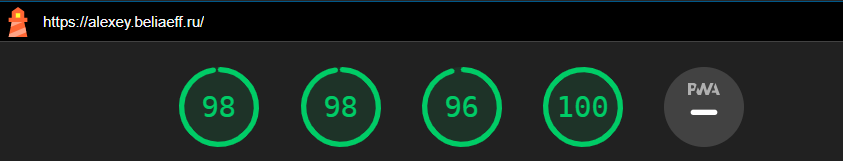
After that I fixed the warning like alt tags, header ordering and smth like this and the indicators increased from '98 – 83 – 52 – 82' to '98 – 98 – 96 – 100' (Performance - Accessibility - Best Practices - SEO) . Good site health is when all the indicators are greater than 90.
Of course, this exercise is too easy, but I already have some bonus – my site is opening faster. It means, less CPU time, less traffic, less money for hosting. For other sites it can be more complex.
I can help you with the operations to improve your site indicators. Join me by WhatsApp +4915738936214 to discuss the possibility and the details.
More details about me at https://alexey.beliaeff.ru/en/
 NodeJS. Fix error "create react app npm ERR! Maximum call stack size exceeded"
 Truncate NGINX log files in Linux (Debian, Ubuntu, CentOs)
 Optimize site performance. How to set leverage browser caching on Nginx